Stocks Won’t Crash Until This Happens

Posted September 02, 2021
Graham Summers
Over the last few days, I’ve been outlining several key items pertaining to today’s markets.
- The markets are in a bubble. This is not up for debate. There is definitive proof.
- There are key signals that flash before a market crash. Those signals involve the most heavily weight stocks in the index breaking down. This was the case in 1987, 2008, and 2020.
- Currently the most heavily weight stocks in the S&P 500 are predominantly in uptrends. For this reason, the likelihood of a crash right now is slim to none.
This is the framework to use going forward: yes, stocks are in a bubble. Yes, this bubble will burst. But based on market dynamics, we’re not there yet.
Today I’d like to introduce another means of looking at the market: through sector weighting.
The S&P 500 is made up of 500 companies as I mentioned earlier this week. However, these companies can be grouped into sectors, or areas of the economy.
The S&P 500 is made up of 11 sectors. They are:
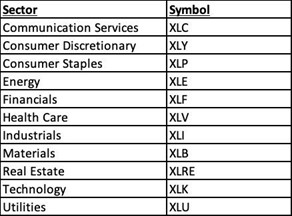
As is the case with individual companies, these sectors all receive different market weighting. The current market weighting is:
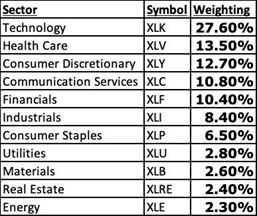
The first thing that jumps out is that Tech completely dominates the weighting of the S&P 500. This single sector accounts for nearly 28% of the entire market weight. In fact, it is larger than both the 2nd and the 3rd largest sector weightings (Healthcare and Consumer Discretionary) combined.
The media has posted numerous articles and comments that most of the market gains of the last few years has come from a handful of large tech stocks. Now you know why this is. You also know why multiple sectors can collapse, but provided Tech remains in an uptrend, the overall market will grind higher.
In terms of gauging market trouble, Tech is the single most important sector to watch. You can be as bearish as you want, but it is HIGHLY unlikely the market will crash without Tech first rolling over and collapsing.
Today, Tech remains in a strong uptrend. A critical line to watch is its 100-day moving average. As the below chart shows, Tech has been supported by this line throughout the rally from the March 2020 lows.

I would urge you to use this as a simple gauge for market health. Until Tech breaks below its 100-DMA and stays there, the odds of a full-scale market crash are quite low.
Best Regards,
Graham Summers
Editor, Money & Crisis