This Indicator May be Signaling Trouble for Stocks

Posted June 14, 2021
Graham Summers
After chopping around for the better part of two months, the S&P 500 finally staged a breakout to the upside of its box pattern last week. The onus is now on the bulls to see if they can confirm this breakout by pushing prices higher.
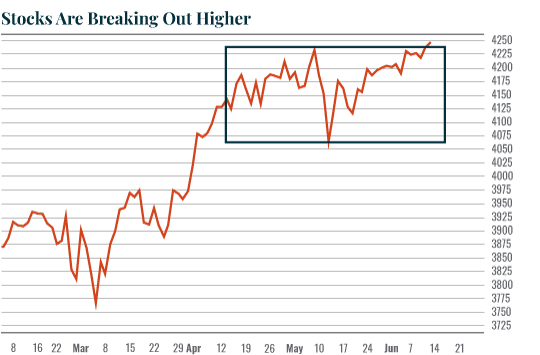
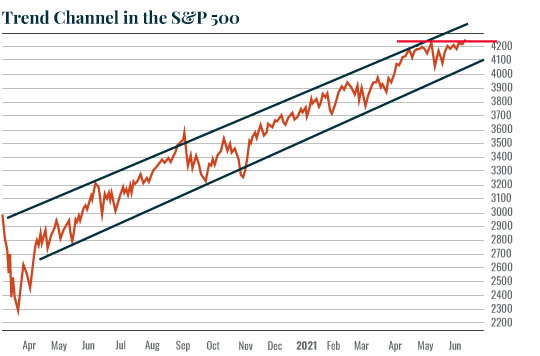
This opens the door for a run to 4,300 in the S&P 500. That would bring stocks to the top of the trading channel that has determined price action from the March 2020 lows.
It’s not all a bed of roses, however. There are multiple signs that a significant drop is coming, maybe not this week, but soon.
One Indicator that May Be Signaling Trouble
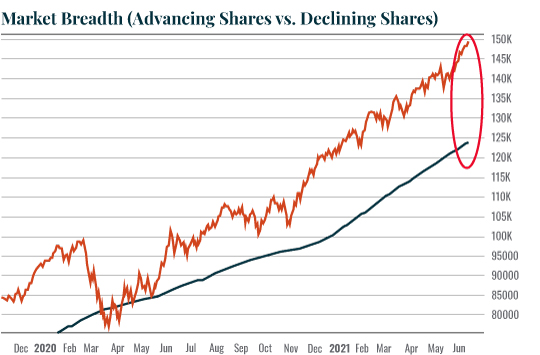
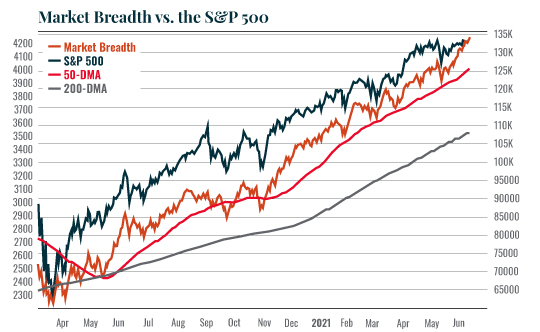
Breadth (advancing stocks vs. declining stocks) is EXTREMELY stretched above its 200-day moving average (DMA). I’m not certain if this is the most stretched breadth has ever been, but it’s certainly the biggest stretch in years (see the red circle in the chart below).
Previous episodes in which breadth was in a similar place relative to its 200-DMA saw significant corrections occur. I’ve illustrated them in the below chart with red rectangles.
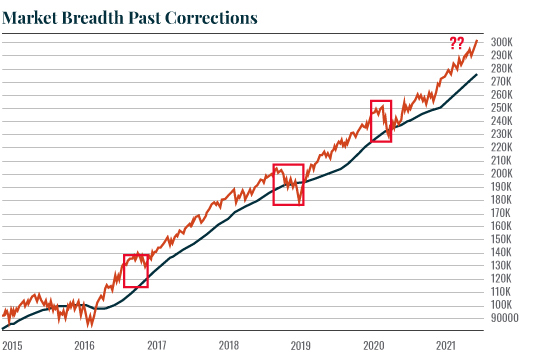
A correction in market breadth down to its 200-DMA would correspond with the S&P 500 falling to test 3,500. That seems rather extreme, but a drop to test the 50-DMA doesn’t seem far-fetched. Such a drop would see the S&P 500 fall to 4,000.
What would trigger such a collapse? There are certainly no shortages of possibilities:
- The economy rolls over.
- Inflation begins to eat into profit margins, lowering corporate profits.
- Inflation expectations soar suggesting the Fed will be forced to taper/ end its interventions and tighten monetary policy.
-
- A true black swan even no one sees coming (another COVID-19 variant? War? A major funding issue with a foreign bank?)
I’ll outline which one I think it is in tomorrow’s article. Until then…
Best Regards,
Graham Summers
Editor, Money & Crisis